")
")


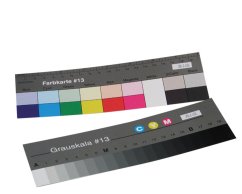
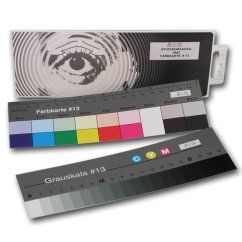
Both the step grey wedge and the colour chart are intended for photos that will be printed as well as for exact colour and tone reproduction on the monitor. Ideal also as a template for your own film tests. ... Read More
Instruction table for colour separations and grey scale #13 (small)
Grey Scale #13
This grey scale is a precision testing tool with graduated neutral tones. The scale helps the photographer to
(1) compare the reflected tonal values of the original images with the tonal values of their image reproduction, (2) assess photographic exposure and processing and to render them neutral in the classical colour reproduction process, which requires the use of masks and separation films, as well as to establish brightness values for printing characteristics. The grey scale consists of 20 degrees of density; the density values between the individual gradations are 0.10. Relative density values increase nominally in front of "white" with approx. 0.05 up to 1.95. These values are strictly monitored and differ only slightly from the nominal value. Neutrality and uniformity are also strictly monitored. The background approaches the value of 18% neutral grey to neutralise the overexposure in the lens as well as the ambient effects.
NOTE: The boxes marked A, M and B are used in the Kodak 3-point control process to reproduce colour originals using common masking techniques and colour separations. The A. M and B fields correspond to reflectance densities of 0.0. 0.70 and 1.60. These densities represent the average light values (highlight), midtones as well as shadow values on the colour or black and white reflectance copy.
How to use the grey scale:
1. Using a densitometer calibrated according to the 150-5 specification, measure the density values of each field of the grey scale. Make a note of the readings taken. If you do not set the densitometer in the comparison procedure with the calibration plate, then it should be calibrated to zero on the white A-field.
2. The grey scale should be placed along the image to be reproduced. Make sure that the film is large enough. to include the grey scale as well. Expose.
3. Using the same densitometer, now determine the density values of each field of the reproduced grey scale. Record the values read.
4a.By comparing the subsequent images of the grey scale, learn whether a change in the conditions of exposure or elaboration occurred. A shift of the density value by 0.10 corresponds to a change by 1/3 of the aperture:
When increasing the density value by 0.10 (by 1 degree darker), the conditions of exposure/processing have increased by 1 3 of the aperture. The change that has occurred is compensated for by reducing the exposure by 1/3 of the f-stop.
When decreasing the density value by 0.10 (by 1 degree brighter), the conditions of exposure/processing have decreased by 1/3 of the aperture. The change that has occurred is compensated for by increasing the exposure by 1/3 of the f-stop.
4b. The measured values determined in point 1 are plotted on a piece of graph paper on the waagerecht diagram axis. The measured values determined in step 3 are entered on the perpendicular diagram axis. By connecting the points, you obtain the sound reproduction curve.
It is recommended that if the grey scale is used frequently, it should be replaced regularly with a new one, about once a month.
Colour chart #13
The colour chart helps photographers compare the colour of the object being photographed with known print colours. The colour chart also helps camera and scanner users. identify colour separations in individual reproduction processes. (Better results can be achieved by printing your own colour patches on your own paper with your own colours - the technical image guide on the back of this sheet should be used for this. Then you can use your own colour patches for colour correction and matching, as well as for identifying the reproduction steps. For a more detailed description, see the chapter "Print your own colour patches".)
In order to achieve a lasting quality, the colour patches are printed with the colours that correspond to the Euro scale specification "Euroscale coated" as well as standard ISO 2846). The solid areas are printed with single colours and using two-colour overprinting of the scale colours. The table also contains fields printed in black, as well as "black" fields printed in three-colour process using the combination of equal amounts of azure, purple, yellow. The fields with lighter colours correspond to quarter tone printing in the value of about 25-same as for the grey scale, the background approaches the value of 18% neutral grey in order to neutralise the upper radiation in the lens as well as the environmental effects.
How to use the colour table when working with colour separations:
- The colour table as well as the grey scale are placed next to the image to be reproduced. Make sure. that they are mapped onto the image reproductions. Expose with the recommended colour separation filters (red. green and blue).
- Compare the colour patches on all separation negatives (or positives).
- The film negatives are light or clear where colour is printed. and dark where no colour is printed. Film positives are just the opposite. i.e. the reverse is true.
The colour chart is not varnished and therefore it can be quickly rubbed and scraped off. If you use the colour table often, it is advisable to renew it regularly, for example once a month.
Print your own colour swatches
.
On this sheet overleaf you will find help for creating masks for printing your own colour swatches - without the neutral grey background. The sketch contains one image for each colour of print. When printed together, you get a colour table exactly with your colours. How to use the mask:
- The sketch is to be copied in 1:1 size onto a steep film.
- Separate four images. The individual images are to be pasted in register (=in line with print crosses) on background films.
- The produced originals are now exposed on individual printing plates.
- The printing process should be done exactly as the usual reproduction work is printed (type and sequence of colours. type of paper). Do not forget. that you are hereby creating your own printing aid for comparing your own results and determining your own corrections -therefore it is necessary to work under strictly observed conditions.
NOTE: These instructions only describe the creation of solid colour fields. Provided you also want to add light tones to your table. add the areas of the corresponding area coverage to the resulting negatives. Such an area coverage should be used, which will produce print dots of approx. 25 with satisfactory results. Do not forget to turn the angles of individual print grids correctly.